Most restaurant maintenance budgets aren’t built — they’re discovered, one surprise invoice at a time. A fryer goes down in March, a walk-in compressor in July, a rooftop HVAC unit in the first heat wave of August. The bills arrive one at a time, each one handled as its own small emergency, and nobody sees the full picture until the year-end numbers come in worse than expected.
A real preventive maintenance budget flips that around. Instead of finding out what maintenance cost you after the fact, you decide what you’ll spend keeping equipment running before it breaks — and you set aside the money for the failures you know are coming. It’s the difference between managing maintenance and being managed by it.
This guide walks through how to actually build one, from the benchmark down to the line item.
Table of Contents
Start with the benchmark — then leave it behind
The first question every operator asks is “how much should I spend?” The industry rules of thumb give you a starting range. Most restaurants spend somewhere between 1.5% and 3% of annual revenue on maintenance, and a frequently cited healthy target is 1–2% of sales covering both planned and emergency work. The National Restaurant Association has put the average around 1.5% of sales. One number worth remembering: if you’re spending under 1% of revenue, you’re almost certainly not saving money — you’re deferring maintenance that will cost more later.
In dollar terms, that tends to land a fast-food location around $25,000–$40,000 a year, a casual-dining restaurant around $15,000–$30,000, and a fine-dining kitchen with premium equipment around $30,000–$50,000. Useful ranges — but only as a sanity check.
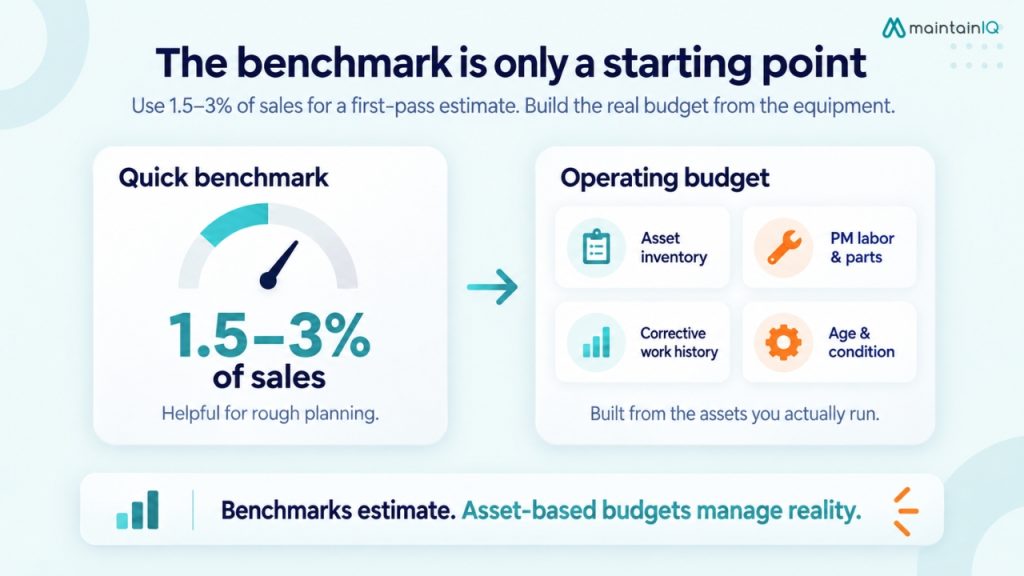
Here’s the important part: a percentage is not a budget. It tells you whether you’re in the ballpark, not what you should actually spend. Your real number depends on your equipment, its age, your menu, and your building. A fine-dining kitchen running combi ovens and sous-vide has nothing in common with a fast-casual spot running a flattop and a fryer. The benchmark is where you start; a bottom-up build is where you finish.
Split the budget into its two real halves
Before you total anything, separate your maintenance budget into two parts. Blending them is the most common budgeting mistake operators make, because the two behave completely differently.
- Operating maintenance (R&M). The recurring cost of keeping equipment running this year — scheduled preventive service, routine repairs, and service contracts. This is predictable if you plan it, and it’s the part most people mean when they say “maintenance budget.”
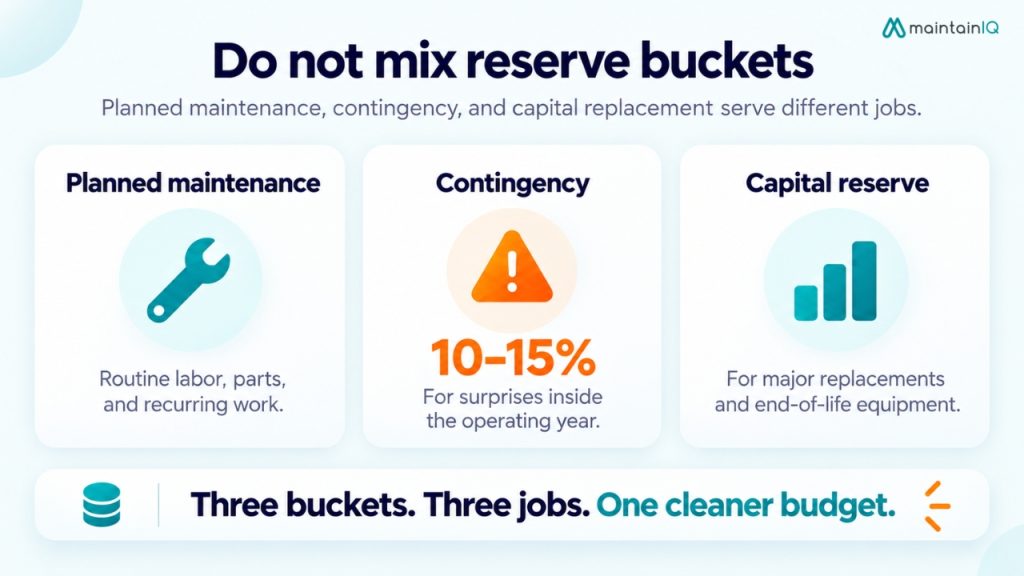
- Capital replacement reserve. Money set aside to replace equipment at the end of its life. A walk-in cooler or commercial oven lasts roughly 10–15 years; when it finally dies, that’s a capital event — often five figures — not a repair. Saving toward it in advance turns a catastrophe into a planned purchase.
Keep these in separate buckets. Your preventive maintenance budget is the operating half, built to run smoothly year to year. The reserve exists so a $12,000 walk-in replacement doesn’t detonate an otherwise healthy operating budget the month it happens.
Build the operating budget from your equipment up
The right way to set the operating number isn’t to pick a percentage and hope — it’s to build from your actual asset list. It takes more effort up front and produces a budget you can actually defend. Five steps:
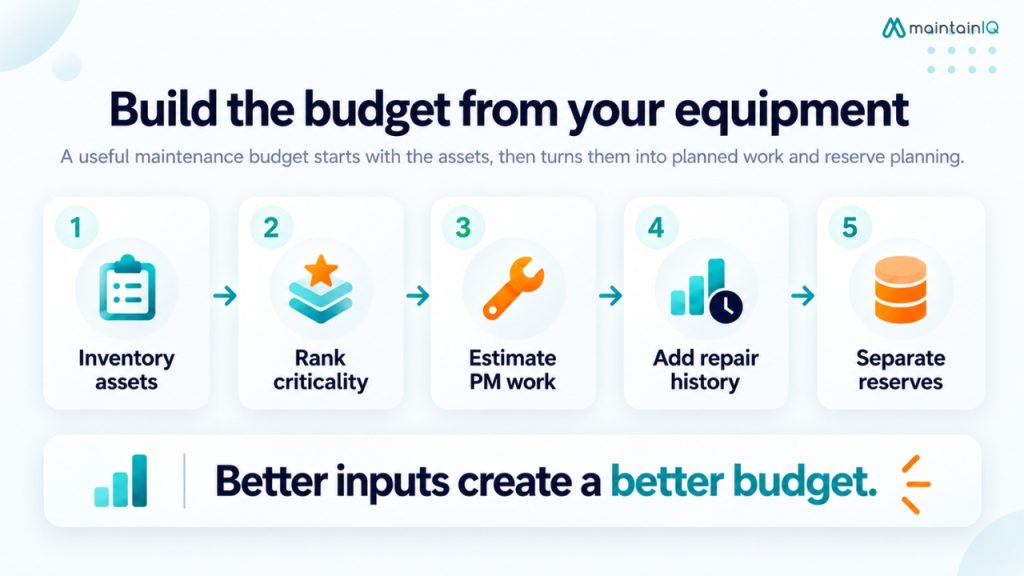
- Inventory every asset. List each piece of equipment with its make, model, age, and install date. This asset registry — the backbone of any equipment maintenance program — is the foundation the whole budget sits on. Equipment you haven’t catalogued is equipment you can’t budget for.
- Assign each asset a PM plan and frequency. Hood cleaning quarterly, refrigeration checks and HVAC tune-ups on schedule, fryer boil-outs, ice-machine cleaning, backflow testing. Much of this is manufacturer-recommended or code-required, so the frequency isn’t really optional. A preventive maintenance schedule turns that list into recurring, plannable work.
- Cost each PM task. Attach a dollar figure to each service, whether it’s a per-visit rate or an annual service contract. Annual contracts on refrigeration and HVAC frequently cost less than a single emergency service call, making them easy budget wins.
- Add expected routine repairs. Beyond scheduled PM, budget a realistic amount for the routine repairs each asset will need based on its age and history. Equipment older than 7–10 years should carry a higher repair allowance — it will need it.
- Total it. The sum is your operating maintenance budget, built from real equipment rather than a national average. Compare that total back to the 1.5–3% benchmark as a gut check — if it’s wildly off, you’ve either missed something or you own equipment that’s telling you it’s near the end.
To make that concrete, picture a casual-dining location built bottom-up. Hood cleaning on schedule might run a few thousand a year; an annual refrigeration service contract another couple of thousand; HVAC tune-ups, fryer and cooking-equipment service, plumbing and grease-trap work, and general facility upkeep each add their own line. Stack those scheduled services together, add a realistic routine-repair allowance for the older assets, and you arrive at an operating figure somewhere in the $15,000–$30,000 range — the same ballpark the percentage benchmark predicts, but now every dollar is attached to a specific asset and service you can point to. That’s a budget you can defend to an owner and adjust with confidence.
The categories a complete budget covers
Whether you build top-down or bottom-up, make sure every one of these categories has a line. A missing category doesn’t mean the cost disappears — it means it arrives later as an unbudgeted emergency.
- Refrigeration — walk-ins, reach-ins, and ice machines. On-demand refrigeration repair consistently tops full-service restaurants’ annual service spend, so this line deserves real attention.
- Cooking equipment — fryers, ranges, ovens, griddles, and specialty gear, each with its own service needs.
- HVAC and ventilation — rooftop units and make-up air, which fail expensively and at the worst possible time.
- Hood and fire suppression — NFPA 96 hood and exhaust cleaning and fire-suppression inspection. Code-required and non-negotiable, so budget it as fixed.
- Plumbing and water systems — grease traps, water heaters, and backflow testing.
- General facility — floors, doors, lighting, HVAC filters, and pest control.
For each category, decide deliberately between a service contract and pay-per-visit. Contracts smooth your spend and often save money on the high-failure systems; per-visit makes sense for simpler or lower-risk assets. Tracking those service arrangements and warranties against each asset keeps you from paying out of pocket for something still under coverage.
Build in the reserve and the contingency
A good budget plans for the failures it can’t schedule, not just the ones it can. Two separate cushions do that work.
A contingency line. Even a well-built PM budget can’t foresee everything, so carry a contingency — a set portion of the operating budget — for genuine surprises. Emergencies are not a possibility to hope against; they’re a certainty to plan for. A common approach is to hold back roughly 10–15% of the operating budget as contingency, adjusting upward if your equipment is older or your history is unpredictable. Budgeting for surprises is what keeps a single bad month from wrecking the annual number.
The replacement reserve. Separately, set aside a monthly amount toward the capital reserve based on your equipment’s age and replacement cost. This is what makes the repair-versus-replace decision rational: a $1,500 repair on a ten-year-old asset worth $2,000 rarely makes sense, but you can only choose to replace instead of endlessly repairing if the money is already there. Without a reserve, you’re forced to pour cash into dying equipment because replacement isn’t in the budget.
A budget is only as good as your tracking
A budget you set in January and never look at again is a wish, not a plan. The final piece is tracking actual spend against your budget — by asset, by category, and by location — so the numbers stay honest and next year’s budget gets sharper.
This is where the data earns its keep. Tracking every repair as a work order tied to a specific asset tells you which fryer breaks every month and which walk-in is quietly eating most of your service budget. That history turns next year’s budget from a guess into a refinement, and it flags the assets that have crossed from “repair” into “replace.”
The tracking also proves why the preventive half of the budget is worth funding. Preventive maintenance saves restaurants up to 18% year over year compared with reactive repair, and every dollar spent on PM is estimated to save around five dollars in future repairs — while skipping it drives repair costs two to five times higher than planned upkeep. The full case for scheduling over reacting is worth reading on its own in why 90% of maintenance should be scheduled.
And don’t forget the cost that never appears on any invoice: downtime. A single day of equipment-related shutdown can cut a restaurant’s monthly profit by 10–20%. That lost revenue is the real reason a maintenance budget pays for itself — the money you spend preventing failures is small next to the money a failure costs you in closed hours and spoiled inventory.
Review the budget on a cadence, not just at year-end. A quarterly check against actual spend is enough to catch problems while you can still act on them: a category running hot, a single asset generating repeat repairs, a location drifting well above the others. Waiting twelve months to compare budget to reality means you find out about a $400-a-month problem after it’s cost you $5,000 — the same reactive trap the whole exercise is meant to escape, just applied to the budget itself.
Common budgeting mistakes to avoid
A few predictable errors turn an otherwise reasonable budget into next year’s shortfall:
- Budgeting only for repairs. If the number only covers fixing things that break, you’ve budgeted for reactive maintenance and guaranteed you’ll stay in it. Fund the preventive services first.
- Forgetting the replacement reserve. An operating budget with no capital reserve means every end-of-life failure becomes an emergency you can’t afford — and a repair on equipment that should be replaced.
- Copying last year’s number. Last year’s spend isn’t a budget; it’s history, and it silently bakes in whatever emergencies and deferred work happened. Build from equipment, not from the prior total.
- Setting it and forgetting it. A budget you never track against can’t tell you when a single asset is quietly consuming it. Without tracking, you’re back to hoping nothing breaks.
- Treating every location the same. A ten-year-old kitchen in a humid climate will not cost what a two-year-old build does. Budget per location, then roll up — don’t spread one average across sites that aren’t alike.
Building and holding the budget with MaintainIQ
MaintainIQ gives you the pieces to build a maintenance budget from the ground up and then actually hold your spending to it. Its equipment maintenance tools let you inventory every asset with its age and history, preventive maintenance scheduling turns required services into recurring, plannable work, and work-order tracking captures what you actually spend against each asset and category.
For a multi-location operator, that rolls up through corporate-level reporting so you can compare maintenance spend across locations, spot the site whose refrigeration is bleeding money, and build next year’s budget on real numbers instead of last year’s guess. The budget stops being an annual surprise and becomes something you manage on purpose.
If your maintenance spend still arrives one invoice at a time with no big-picture view, that’s the first thing worth fixing. Book a 20-minute demo, and we’ll show you how to build and track a preventive maintenance budget across your locations.
Frequently asked questions
What percentage of revenue should a restaurant spend on maintenance?
Industry benchmarks put it between roughly 1.5% and 3% of annual revenue, with 1–2% of sales a commonly cited healthy target covering both planned and emergency work. Spending under 1% usually signals deferred maintenance rather than efficiency. Treat the percentage as a sanity check, not a budget — your real number should be built from your actual equipment and its age.
What should a restaurant maintenance budget include?
A complete budget separates operating maintenance (scheduled PM, routine repairs, and service contracts for refrigeration, cooking equipment, HVAC, hood and fire suppression, plumbing, and general facility) from a capital reserve for replacing equipment at end of life. It should also carry a contingency line for genuine emergencies, since some failures can’t be scheduled.
How does MaintainIQ help build a maintenance budget?
MaintainIQ lets you inventory your assets, schedule preventive maintenance, and track every repair as a work order tied to a specific asset — so you can build the budget bottom-up from real equipment and then measure actual spend against it. Across multiple locations, corporate-level reporting compares spend site by site so each year’s budget is grounded in data.